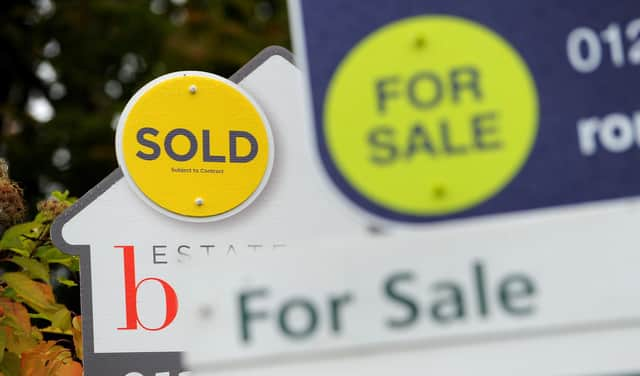
South Holland house prices increased more than East Midlands average in March


House prices increased by 1.7% – more than the average for the East Midlands – in South Holland in March, new figures show.
The boost contributes to the longer-term trend, which has seen property prices in the area achieve 18.9% annual growth – the highest in the East Midlands.
Advertisement
Hide AdAdvertisement
Hide AdThe average South Holland house price in March was £237,336, Land Registry figures show – a 1.7% increase on February.
Over the month, the picture was similar to that across the East Midlands, where prices increased 1.2%, and South Holland outperformed the 0.3% rise for the UK as a whole.
Over the last year, the average sale price of property in South Holland rose by £38,000 – putting the area top among the East Midlands’s 35 local authorities with price data for annual growth.
At the other end of the scale, properties in Rutland gained just 2.5% in value, giving an average price of £361,000.
Advertisement
Hide AdAdvertisement
Hide AdWinners and Losers
Owners of semi-detached houses saw the biggest improvement in property prices in South Holland in March – they increased 2.1%, to £202,466 on average. Over the last year, prices rose by 19.8%.
Among other types of property:
Detached: up 1.5% monthly; up 19% annually; £295,760 averageTerraced: up 1.7% monthly; up 17.9% annually; £162,066 averageFlats: up 0.4% monthly; up 9.7% annually; £95,806 average
First steps on the property ladder
First-time buyers in South Holland spent an average of £201,000 on their property – £33,000 more than a year ago, and £53,000 more than in March 2017.
By comparison, former owner-occupiers paid £258,000 on average in March – 28.5% more than first-time buyers.
Advertisement
Hide AdAdvertisement
Hide AdHow do property prices in South Holland compare?
Buyers paid 1.2% less than the average price in the East Midlands (£240,000) in March for a property in South Holland. Across the East Midlands, property prices are roughly the same as those across the UK, where the average cost £278,000.
The most expensive properties in the East Midlands were in Harborough – £373,000 on average, and 1.6 times as much as more than in South Holland. Harborough properties cost 2.4 times as much as homes in Bolsover (£157,000 average), at the other end of the scale.
The highest property prices across the UK were in Kensington and Chelsea.
Factfile
Average property price in March
South Holland: £237,336The East Midlands:£240,329UK: £278,436
Annual growth to March
South Holland: +18.9%The East Midlands: +12.4%UK: +9.8%
Best and worst annual growth in the East Midlands
South Holland: +18.9%Rutland: +2.5%