
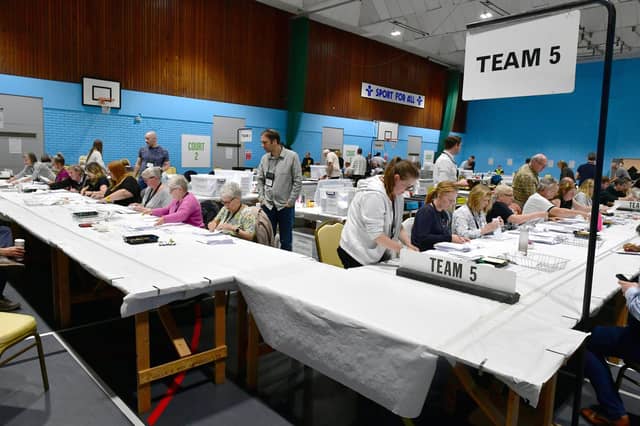

There are six candidates in the race for the Sleaford & North Hykeham seat and following following boundary changes the electorate totalled 75,651 registered electors.
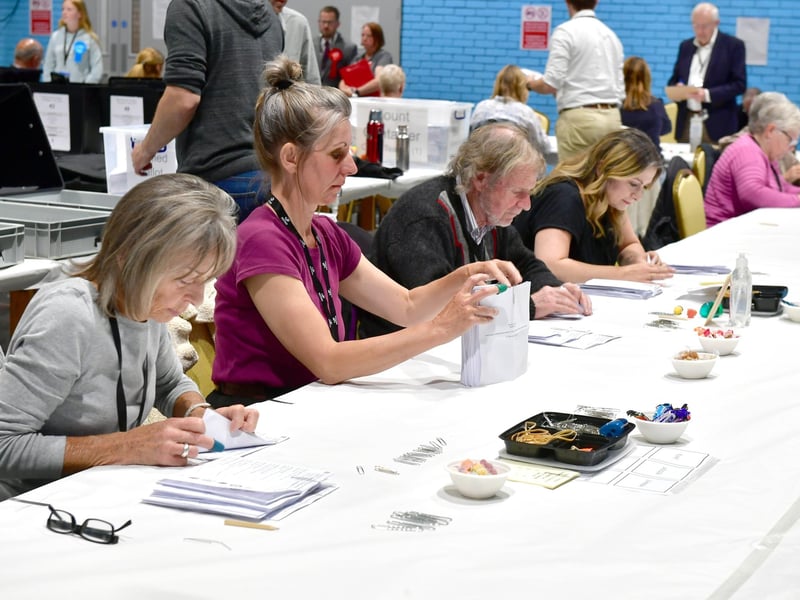
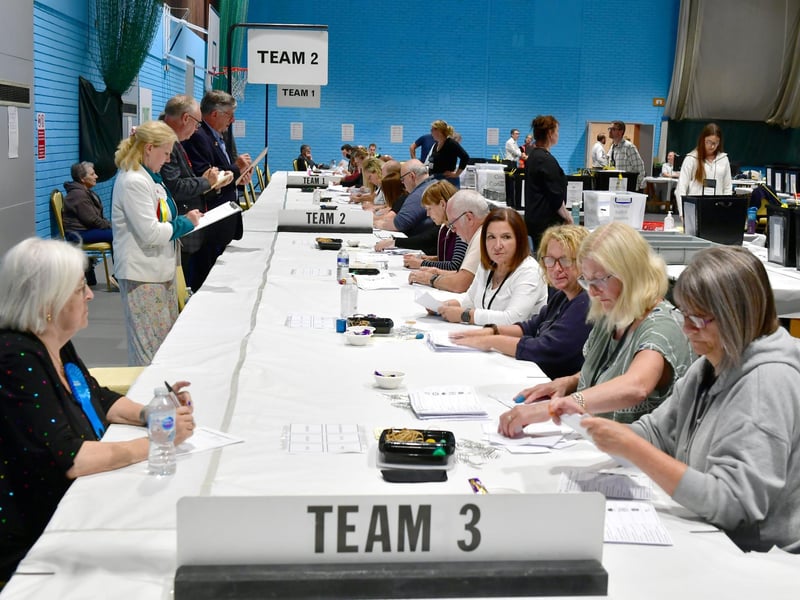
Across the Sleaford & North Hykeham Constituency 64.46% of the 75,651 people who were registered to vote did so. That’s 48,761 ballot papers that are now being sorted into piles for the six candidates.
In the new Grantham & Bourne Constituency that takes in 16 of the villages south and east of Sleaford, turnout was a fraction lower, at 63.4%.
And in the Lincoln Borough Constituency which includes Skellingthorpe, Bracebridge Heath and the east ward of Waddington parish, 58.53% of those who could vote chose to.
At the 2019 general election (when the constituency area was bigger) the turnout was 70.2%.
Candidates standing this time are:
Martin Christopher Blake – Green Party
Benjamin Jackson – Reform UK
Caroline Elizabeth Johnson – Conservative
Hanif Ahmad Khan – Labour
Robert Arthur Oates – Lincolnshire Independents
Matthew Ray Winnington – Liberal Democrats
The declaration of the result is expected around 4am.
Candidates have been arriving at the count at OneNK leisure centre in North Hykeham as exit polls predict a national victory for Labour and Sir Keir Starmer.
There has never been a Labour MP in this constituency or its predecessors.
Dr Caroline Johnson was the first female MP, elected in a by-election in December 2016.
At the time it was described by Stephen Bush in the New Statesman as “one of the party’s all-time best by-election performances while in government”, with more than half of the votes cast, a large majority of 40 per cent and over 10,000 votes. She held the seat into 2019, when the majority was 32,565 votes, the largest majority in terms of number of votes of any seat won by the Conservative Party in the election. Coming fourth in 2016, Labour was described as ‘pushed into irrelevance’.
Historically, the constituency has been a Conservative stronghold, but with a Liberal and an Independent MP at times – last in 1942 through to 1950 followed by 74 years of unbroken Conservatives.
The 2024 boundary change has given back to the new Grantham & Bourne Constituency parts of South Kesteven, plus 16 parishes to the south and east of Sleaford; with Skellingthorpe, Bracebridge Heath and Waddington east parish ward remaining in the Lincoln Borough Constituency. The electorate has been reduced to 75,807.
Previous election results:
2019, Dec – Caroline Johnson, Conservative: 44,683 votes – 67.1% (+2.9%). Majority: 32,565 on a 70.23% turnout and an electorate of 94,761.
2017, June – Caroline Johnson, Conservative: 42,245 votes – 64.2% (+8%). Majority: 25,237 on a 72.4% turnout and a 90,929 electorate.
2016, Dec (by-election following Stephen Phillips’ resignation over policy differences following Brexit) – Caroline Johnson, Conservative: 17,570 votes – 53.5% (-2.7%) Majority: 13,144 (40%) on a 37.1% turnout. Ten candidates stood in total.
2015 – Stephen Phillips, Conservative: 34,805 votes – 56.2% (+4.6%). Majority: 24,115 (38.9%) on a 70.2% turnout.
2010 – Stephen Phillips, Conservative: 30,719 votes – 51.6% (+1%). Majority: 19,905 (33.4%) on a 69.6% turnout.
2010 Boundary Change brought in some of South Kesteven, with reshaping around the Lincoln boundary.
2005 – Douglas Hogg, Conservative: 26,855 votes – 50.3% (+0.6%). Majority: 12,705 (23.8%) on a 73% turnout.
2001 – Douglas Hogg, Conservative: 24,190 votes – 49.7% (+5.7%). Majority: 8,622 (17.7%) on a 64.9% turnout
1997 – Douglas Hogg, Conservative: 23,358 votes – 43.9%. Majority: 5,123 (9.6%) on a 74.4% turnout.
Re-named Sleaford & North Hykeham through boundary change taking effect in 1997.
Previously Sleaford area fell under Grantham Constituency and the northern parts within Lincoln
1992 – Douglas Hogg, Conservative: 37,194 votes – 56.2% (-0.9%). Majority: 19,588 (29.6%) on a 79.2% turnout
1987 – Douglas Hogg: Conservative: 33,988 votes – 57.06%. Majority: 21,303 (35.76%) on a 74.99% turnout.
1983 – Douglas Hogg, Conservative: 31,692 votes – 57.47%. Majority: 18,911 (34.29%) on a 73.49% turnout.
1979 – Douglas Hogg, Conservative: 36,697 votes – 55.52%. Majority: 18,150 (27.46%) on a 78.24% turnout.
1974, October – Joe Godber, Conservative: 27,738 votes – 47.66%. Majority: 8,030 (13.8%) on a 74.23% turnout.
1974, February – Joe Godber, Conservative: 31,910 votes – 50.44%. Majority: 11,343 (17.93%) on a 81.37% turnout.
1970 – Joe Godber, Conservative: 33,070 votes – 58.7%. Majority: 9,774 (17.4%) on an unspecified turnout.
1966 – Joe Godber, Conservative: 24,748 votes – 47.7%. Majority: 2,158 (4.2%) on a 80.6% turnout.
1964 – Joe Godber, Conservative: 27,634 votes – 55.9%. Majority: 5,864 (11.8%) on a 78.8% turnout.
1959 – Joe Godber, Conservative: 27,482 votes – 56.8%. Majority: 6,615 (13.7%) on a 81.9% turnout.
1955 – Joe Godber, Conservative: 24,188 votes – 50.8%. Majority: 2,375 (5%) on an unspecified turnout.
1951 – Joe Godber, Conservative: 20,712 votes – 43.47%. Majority: 2,172 (4.56%) on an unspecified turnout.
1950 – Eric Smith, Conservative: 19,195 votes – 41.33%. Majority: 4,738 (10.2%) on an unspecified turnout.
1945 – Denis Kendall, Independent: 27,719 votes – 58.2% (+7.4%). Majority: 15,513 (32.6%) on a 75.9% turnout.
1942 – Denis Kendall, Independent: 11,758 votes – 50.8%. Majority 367 (1.6%) on a turnout of 42.6%.
1935 – Sir Victor Warrender, Conservative: 22,194 votes – 58.1%. Majority: 6,185 (16.2%) on a 74.2% turnout.
1931 – Sir Victor Warrender, Conservative: 27,164 votes – 69.2%. Majority: 15,049 (38.3%) on a 79.5% turnout.
1929 – Sir Victor Warrender, Unionist: 16,121 votes – 40.8% (-8.7%). Majority: 4,098 (10.3%) on a 81.9% turnout.
1924 – Sir Victor Warrender, Unionist: 14,746 votes – 49.5%. Majority: 7,016 (23.5%) on a 80.4% turnout.
1923 – Sir Victor Warrender, Unionist: 12,552 votes – 43.5% (+3.7%). Majority: 7,016 (23.5%) on a 80.4% turnout.
1922 – Robert Pattison, Liberal: 11,723 votes – 41.4% (-0.8%). Majority: 428 (1.6%) on a 79.5% turnout.
1918 – Edmund Royds, Unionist: 9,972 votes – 48.4%. Majority: 1,271 (6.2%) on a 58.1% turnout.
1910, December – Arthur Priestley, Liberal: 1,730 votes – 50.5%. Majority 33 (1%) on a 94% turnout.
1910, January – Arthur Priestley, Liberal: 1,848 votes.
1906 – Arthur Priestley, Liberal: 1,663 votes.
1900 – Arthur Priestley, Liberal: 1,347 votes – 50.7%. Majority 38 (1.4%) on a 87.2% turnout.
Sleaford Constituency – abolished 1918
1910, January – Edmund Roys, Conservative: 5,265 votes - 56.8% (+8.5%). Majority 1,265 (13.6%) on a 89.2% turnout.
1910, December – Edmund Roys, Conservative: Unopposed
1906 – Arnold Lupton, Liberal: 4,355 votes – 51.7% (+12%). Majority: 293 (3.4%) on a 84.2% turnout.
1900 – Henry Chaplin, Conservative: 4,228 votes – 60.3% (-3.1%). Majority 1,443 (20.6%) on a 71.1% turnout.
Chaplin won in 1885 and successfully defended 1886, 1889, 1892, 1895 and 1900.
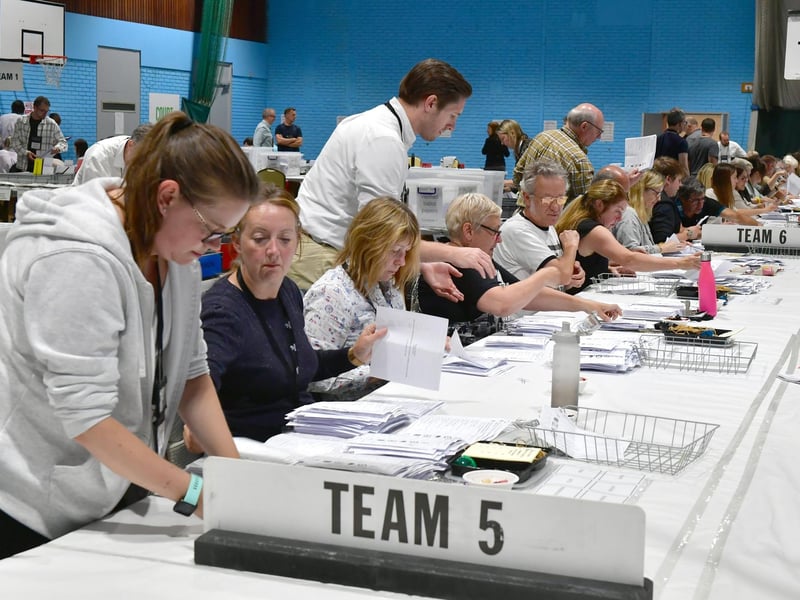
1. Counting
Counting underway. Photo: David Dawson
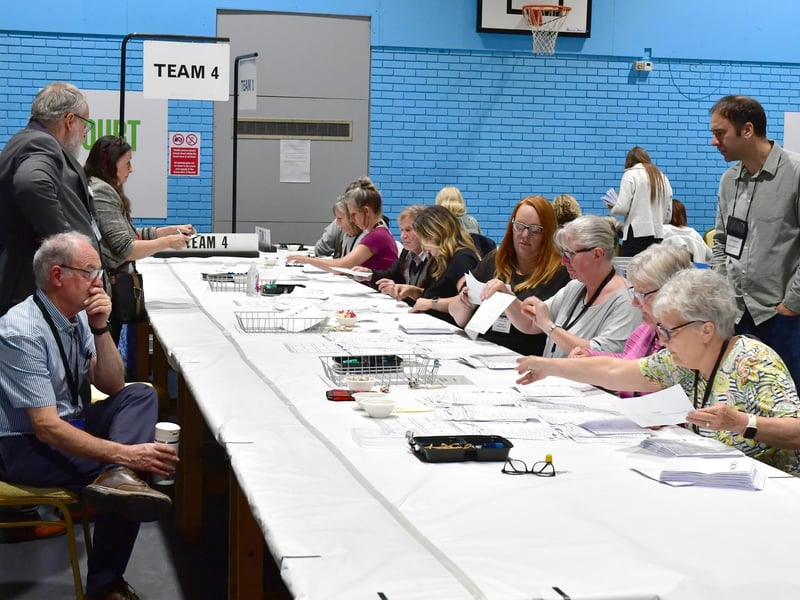
2. Counting
Counting in progress at Sleaford and North Hykeham. Photo: David Dawson Photo: David Dawson
3. Verification in progress
Verification in progress. Photo: David Dawson
4. Verification in progress
Verification in progress Photo: David Dawson